
7.1 Spectroscopy
In 1802, the British natural philosopher William Hyde Wollaston discovered dark lines in Isaac Newton’s colour spectrum (discussed in Chapter 3). These are now known as spectral lines. Wollaston’s discovery may have been attributed to flaws in the prism he used to create the spectrum, but he soon saw that they were always in the same place, whatever prism he used.[1]
The German optician Joseph von Fraunhofer independently discovered spectral lines in 1814. Fraunhofer mounted a prism in front of a small telescope to create a spectroscope. With this new technology, he was able to map over 570 spectral lines and created the field of study known as spectroscopy.[2]

Figure 7.1 |
Spectral lines in light from the Sun. |
7.2 Doppler-shifted lines
Hippolyte Fizeau showed that light is affected by the Doppler effect in 1848.[3] The Doppler effect was discovered by the Austrian natural philosopher Christian Doppler in 1842.[4] Doppler showed that the frequency and hence the wavelength of sound will change, depending on whether it’s moving towards you or away from you.
When it’s stationary, the wavelength and frequency of an ambulance siren, for example, will be the same in all directions. The wavelength appears shorter, and the sound higher-pitched, as it moves towards you. This is because the ambulance catches up with the waves it emits, and so the space between emissions is shorter.
The wavelength appears longer, and the sound lower-pitched, if the ambulance is moving away. This is because in the time between emissions, it moves further from the direction of the waves that you hear, and so the space between emissions is longer.
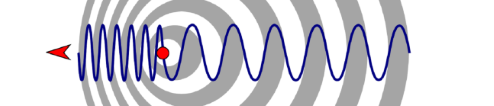
Figure 7.2 |
The Doppler effect. |
Fizeau found that the Doppler effect causes light to appear more energetic, and therefore bluer, when it’s moving towards you and less energetic, and therefore redder, when it’s moving away.
This effect could be seen in the position of spectral lines, and Fizeau showed that the relative velocity of stars could be determined by comparing the position of the lines in their spectra to the position of lines measured in the laboratory.
| Δλλ = Δνν = vc | (7.1) |
Here, λ is the wavelength where the spectral line appears for light from the Sun and Δλ is the change in wavelength between this and the wavelength where the spectral line appears for light from something moving relative to the Sun. v is the velocity at which it’s moving, c is the speed of light, and ν is the frequency.
Edwin Hubble later discovered evidence for the big bang when he showed that almost all galaxies have redshifted spectra and are therefore moving away from us[5] (discussed in Book I).
7.3 Absorption and emission lines
In the 1860s, the German natural philosophers Gustav Kirchhoff and Robert Bunsen showed that spectral lines are caused by different chemical elements absorbing or emitting light at specific energies[6]. The dark lines found in the spectra of stars are absorption lines. These are caused by clouds of gas that absorb some of the star’s light before it reaches Earth. These clouds can then emit this light at the same specific energies, creating emission lines.
Kirchhoff and Bunsen determined the energies of lines produced by different elements in the laboratory. In 1864, the British astronomer William Huggins and the Irish-British astronomer Margaret Huggins showed that stars are made of some of these elements and that they are mostly made of hydrogen.[7]
In 1885, the Swiss mathematician Johann Balmer discovered an equation linking the energies of all the hydrogen lines in the visible spectrum[8] and the Swedish physicist Johannes Rydberg improved upon this equation in 1888.[9] In the 20th century, Niels Bohr’s theory of the atom was used to explain why particular elements are associated with particular energies[10] (discussed in Chapter 10).

Figure 7.3 |
Spectral lines shifted due to the Doppler effect. |

Figure 7.4 |
Continuous, absorption, and emission spectra. |
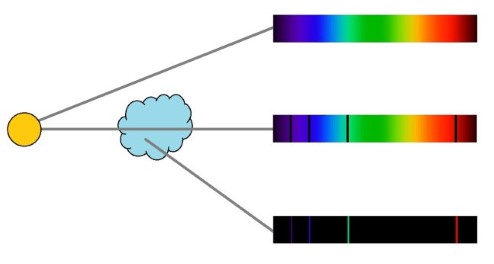
Figure 7.5 |
Blackbodies, like stars, produce a continuous spectrum, absorption lines are caused by hot gases that absorb some of this light, and emission lines are caused by hot gases emitting light. |
7.4 Blackbody radiation
Kirchhoff coined the term ‘blackbody’ to describe a hypothetical object that emits a continuous spectrum, with no absorption or emission lines.[11] A blackbody absorbs all of the light that hits its surface. This means that it doesn’t reflect light (and so cannot act as a mirror) and it doesn’t let light pass through it.
When a blackbody is cold, it’s completely black, and as it heats up it remains in thermal equilibrium, emitting light at all wavelengths. There’s no such thing as a perfect blackbody, but there are lots of objects that are close, including the filaments of light bulbs, the hob of electric ovens, larva, metals like iron, and stars.
The relationship between a star’s energy and temperature was not known until 1879 when the Austrian physicist Josef Stefan showed that the total energy emitted by a blackbody is proportional to its temperature to the power of four.[12] Five years later, Stefan’s first PhD student, the Austrian physicist Ludwig Boltzmann, explained this using thermodynamics and James Clerk Maxwell’s theory of light.[13]
Stefan and Boltzmann knew,
| F = L4πd2 | (7.2) |
Here, F is the energy flux - energy per m2 per second, L is the luminosity - energy per second, and 4π2 is the surface area of a sphere, where the distance between the observer and the luminous object (d) is the radius of the sphere (r).
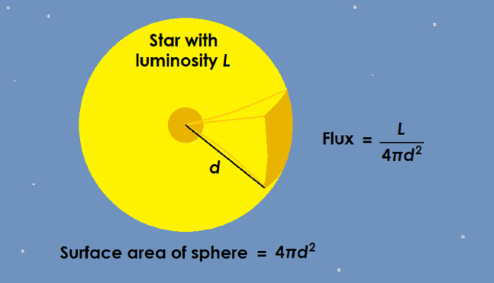
Figure 7.6 |
Flux is the luminosity (energy per second) per surface area. |
Stefan and Boltzmann showed that at the surface of a blackbody,
| F = L4πr2 = σT4 | (7.3) |
Here, T is the effective temperature - the temperature assuming it’s a perfect blackbody, and σ is a constant known as the Stefan-Boltzmann constant.
Stefan and Boltzmann were able to determine the temperature of the Sun’s surface by comparing it to blackbodies on Earth. They estimated that the surface of the Sun is about 5700 Kelvin (about 5427 °C), which is only about 80 Kelvin (80 °C) less than the currently accepted value.
7.4.1 Wien’s law
In 1893, the German physicist Wilhelm Wien showed that the peak wavelength of the light emitted by a blackbody (λmax), which determines its colour, only depends on its temperature (T). As it heats up, getting more energetic, the light from a blackbody will decrease in wavelength. It will move through the spectrum becoming red, orange, yellow, green, and then blue, no matter what it’s made of.[14] Once the temperature of stars could be determined from their colour, their radius could be determined using the Stefan-Boltzmann equation.
| λmax = 0.0029T | (7.4) |
Here λmax is measured in metres and T is measured in Kelvin.

Figure 7.7 |
As a blackbody gets hotter, it emits light with shorter wavelengths, becoming bluer. |
Wien developed his theory by treating light as if it were made of particles. By the end of the century, however, the German physicists Heinrich Rubens and Ferdinand Kurlbaum showed that Wien’s theory does not apply to infrared light.[15,16] This problem would be solved by Albert Einstein and the German physicist Max Planck, using early theories of quantum mechanics (discussed in Chapter 8).
In 1896, the Dutch physicist Pieter Zeeman discovered that spectral lines can be split by passing the light through a magnetic field,[17] and in 1913, the German physicist Johannes Stark[18] and the Italian physicist Antonino Lo Surdo[19] showed that spectral lines can also be split using electric fields. These effects would later be explained using a quantum theory of the atom devised by Bohr in 1913 (discussed in Chapter 10) and developed by Arnold Sommerfeld[20] and the British physicist Paul Dirac[21,22] in the 1920s (discussed in Chapter 11 and Chapter 12).